
Do Cold Emails Still Work in 2026
Published cold email reply rates range from 0.45% to 4.5% for the same channel in the same year. The gap is almost entirely arithmetic, not performance, and one agency moved its own number thirteen times by changing the denominator.
Yes. That is the boring half of the answer.
The interesting half is that nobody can tell you how well, including the companies publishing the benchmarks, because the published numbers disagree by a factor of ten and the disagreement is almost entirely about arithmetic rather than performance.
The benchmarks, side by side
I went and read every published cold email reply-rate study I could reach, and recorded the sample, the date and crucially the method.
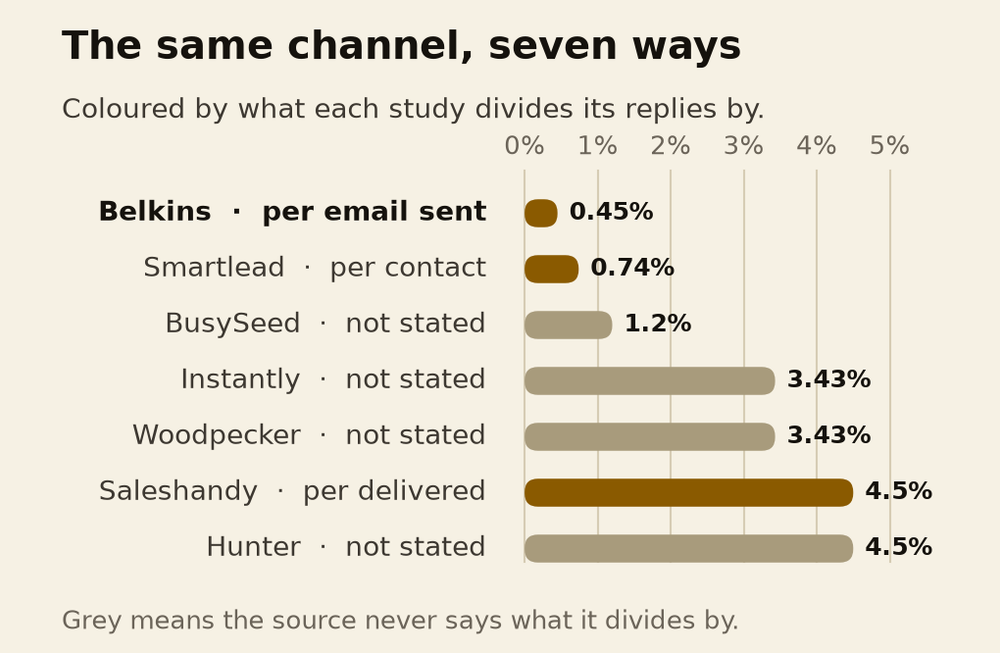
A few things fall out immediately.
All five primary datasets are vendor data. Belkins, Smartlead, Instantly, Saleshandy and Hunter. Every one sells cold email software or managed campaigns. I could not find a single measurement from a party with nothing to sell. That is not an accusation, it is a structural fact about the category: the only people who can see millions of cold emails are the people running the pipes.
One of the famous numbers is one number. The 3.43% figure appears on Instantly, Woodpecker, Lemlist and Apollo. Woodpecker attributes it to Instantly. Lemlist attributes it to Woodpecker. Apollo attributes it to somebody else again. It is a single dataset being cited four times, which in a casual read looks like four sources agreeing.
Two platforms describe different universes. Smartlead's top 10% of senders start at 2.63%. Instantly's *average* is 3.43%. Smartlead's best decile sits below Instantly's mean. Both are real measurements. They cannot both be describing the same activity.
The cleanest evidence that this is definitional
Belkins published a 0.45% reply rate for 2025, across 7,530,489 emails and 34,393 replies.
Its earlier studies reported 5.8%.
Belkins explains the change on its own page. The old studies divided replies by unique openers. The new one divides by total emails sent, which it calls "a stricter and, frankly, more honest denominator." It also excludes auto-replies and bounce notices, and it had open tracking switched off for the whole year.
The same company, running the same kind of campaigns, moved its own published number by about thirteen times by changing what sat under the division line.
Some of that gap is a genuine year-on-year decline. Most of it is not.
The four levers, and roughly what each is worth
Here is the decomposition nobody publishes. The arithmetic below is mine, built on sourced numbers, and I am labelling it as derived rather than measured.
Lever one: openers or sends. This is the biggest. If the true rate per email sent is 0.45%, dividing by openers instead inflates it by one over the open rate. At a reported 21% open rate that becomes 2.1%. At 30% it becomes 1.5%. Worse, openers are no longer a real quantity, which I will come back to.
Lever two: per contact or per email. A four-step sequence sends one contact four emails. Divide unique replies by contacts rather than by sends and the rate roughly quadruples. Smartlead divides by contacts. Belkins divides by sends. Instantly's own report uses two different denominators in different places and never says which produced the headline.
Lever three: auto-replies. The only figure I could find puts out-of-office and automated responses at about 45% of all cold email replies, and it is attributed inconsistently across sites, so treat it as secondhand. If it is even roughly right, a platform that counts them reports almost double a platform that does not. Belkins excludes them and says so. Lemlist's published definition explicitly counts out-of-office as a reply. Smartlead, Saleshandy and Hunter are silent, which means a reader cannot reproduce any of their headlines.
Lever four: median or mean. Smartlead publishes a median and says plainly that it does so because a few very high performers pull an average up. Instantly publishes a mean. In a distribution this skewed those are not comparable quantities.
Multiply four levers that are each worth between 1.5 and 4 times and you can manufacture a tenfold spread without anything changing about how well cold email works.
Open rate has not been a real number since 2021
Worth stating flatly, because so much advice still rests on it.
Apple Mail Privacy Protection shipped in September 2021. It downloads remote content in the background whether or not the recipient opens anything, routed through relays so nobody can connect the fetch to a person. Litmus, analysing over 1.5 billion opens, puts Apple Mail at about 77% of the tracked open market and estimates that privacy protection touches roughly 55 to 60% of all opens. Gmail has proxied images since 2013.
Even the vendors who report open rates distrust them. Saleshandy calls it one of the least trustworthy metrics. Smartlead states that reported opens of 60 to 70% are largely automatic and excludes the metric entirely. Belkins turned tracking off for a year.
And Google says, in its own sender documentation, that it does not track open rates and that a low open rate is not necessarily an indicator of a deliverability problem.
So any reply rate whose denominator is openers is dividing by a number that is mostly machines. That is lever one, and it is the one that produced the highest published figures.
What I measured, and what it is worth
Across 44 campaigns for one client we sent 470,293 emails. Overall reply rate was 2.12%. Of those replies, 16.6% were positive.
I will hold myself to the standard I just applied to everyone else. That 2.12% is replies divided by emails sent. It is not corrected for auto-replies, so it is not directly comparable to Belkins' 0.45%, and it is less flattering than any figure that divides by contacts.
Now the part that actually matters.
The best single campaign in that set hit a 47.4% positive reply rate, against a set-wide average of 16.6% of replies being positive.
Both of those are shares of replies, not shares of people reached. I am stating that explicitly because the whole article is about denominators and I would be a hypocrite to leave it ambiguous. The campaign did not get a positive reply from half the people it emailed. It got a positive reply from nearly half the people who answered, where the set average was one in six.
Same team. Same product. Same sending infrastructure. Same person writing.
The variance between your own campaigns is enormous compared with the variance between published industry averages. You are arguing about the wrong number.
An average across 44 campaigns describes nothing you can act on. It is the arithmetic of mixing one excellent list with forty mediocre ones.
What a reply is actually worth
A caution I owe you, because this is where the channel gets oversold.
A reply is not revenue. "Send me a deck" is not revenue. "Interesting, circle back in Q2" is not revenue, and I have watched business development hires count both as wins because reply rate was the number they were measured on.
Gong, looking at over 28 million cold emails from its customers, puts it at roughly 344 cold emails to land one meeting. Not a reply. A meeting. And a meeting is still several steps from money.
If you are going to track one number, track emails to closed revenue, and accept that it will take you two quarters to have an honest version of it. Everything above that in the funnel can be gamed, usually without anybody intending to.
A kill rule you can apply on a Wednesday
The most useful question nobody answers is when to stop a campaign. Here is what I use.
- Do not judge anything before 300 delivered emails to one segment. Below that, a reply rate of 1% versus 3% is noise. At 300 sends, two replies versus six is still a coin flip you are reading as a signal.
- Do the kill arithmetic for your own numbers rather than copying a round one. Mine: a 2.12% reply rate with 16.6% of replies positive is a positive rate of about 0.35%, so 500 sends should produce roughly 1.8 positive replies. Seeing zero at 500 happens by chance about one time in six. That is far too often to kill a campaign on. At 1,000 sends you expect about 3.5 and zero becomes roughly a one in thirty event, which is a real signal.
- So the rule is 1,000 delivered with zero positive replies, then stop, and the general form is: find the volume where your expected positive count reaches about three, and judge there. I originally wrote 500 in this article and the arithmetic does not support it.
- Judge on positive replies only. Strip auto-replies and out-of-office before you look at anything, or you are grading yourself on holiday calendars.
- Change one thing at a time. List, or offer, or first line. Change two and you learn nothing, which is how teams run twelve campaigns and finish knowing exactly as much as they started with.
- Compare against your own best campaign, not an industry average. Your 47.4% equivalent is the target. The published median is a number from somebody else's customers.
What actually moves it
Hunter's data shows lists of 50 contacts or fewer replying at 5.8%, against 2.1% for lists of 1,000 or more. Direction confirmed in Woodpecker's data too. That is the whole game in one statistic.
The smaller list is not magic. A smaller list is the only condition under which you can write a first line that could not have been sent to anyone else. When you widen a list to hit a volume target, you are simultaneously making the message more generic, because you have to. The two decisions are the same decision.
One more thing, since everyone asks. There is no neutral study showing AI-written outreach performs better or worse. I found two vendor tests that bothered to control anything, and they disagree in direction. The only randomised study with an academic shape covers colleagues emailing each other, not strangers, and found rewriting changed nothing. One vendor reports AI-written emails being flagged as spam more than twice as often, which is a single company's number and may just describe volume.
The honest answer
Cold email works. The median campaign is unremarkable and the spread is enormous, which means the channel is not the variable. You are.
If your campaigns are failing, almost nothing in this article will fix them, because the fix is a narrower list and a first line that proves you looked. That is slow, unglamorous work and no tool sells it.
Stop asking whether the channel is dead. Go and read your last campaign's positive replies, all of them, and ask what those people had in common.
That list is your next campaign.

Ahmad Zabir
GTM expert and marketing consultant for SaaS companies, software houses and fitness brands. He diagnoses why growth stalls, designs the fix, and trains the team to run it.
One teardown a month
Research like this, before it goes public. No cadence promises I will not keep.
Cold Email vs LinkedIn: What the Numbers Actually Say
Most comparisons divide LinkedIn replies by accepted connections and email replies by emails sent, which rigs the result. Corrected per prospect, the gap is under two times, and the same audience data says the channels reach different people.
Cold Email Deliverability: Placement Problem or Targeting Problem
A placement problem and a targeting problem produce the same symptom and need opposite fixes. How SPF, DKIM and DMARC actually work, why bounce rate measures neither, and the twenty minute test that separates them.
How Many Cold Emails You Can Send Per Day, Per Domain
No mailbox provider publishes a safe cold email volume. What Google and Microsoft actually document, why the published vendor caps disagree by eight times, and how to tell which of your domains is actually burned.
What Is a GTM Agency, and What It Is Not
A GTM agency owns the whole path from product to collected cash, across positioning, demand, sales and revenue operations. How that differs from a marketing agency, a sales strategy and revenue operations, the four ways it breaks, and when you actually need one.
Not sure which of these you actually need?
Bring your funnel and your numbers. You leave knowing what to fix first and what to ignore.
Apply for a Consult