
Find the Broken Layer in Your Funnel, Using Your Own CRM
Traffic looks fine, revenue is flat, and nobody can say why. How to diagnose it from your own CRM: confidence intervals on small samples, Simpson's paradox, survivorship, and where deals pile up versus vanish.
Revenue is flat. Traffic looks fine. Calls are happening. Nobody in the building can say why.
Before you hire anyone to tell you, you can find it yourself. Most of the work is arithmetic, and the hardest part is not the maths. It is resisting four specific ways that funnel data lies to people who look at it honestly.
Why your eyes are wrong about small numbers
Start here, because almost every funnel diagnosis I see is built on sample sizes that cannot support it.
If 5 of 20 deals converted at a stage, your conversion rate is 25%. The honest version is that the true rate is somewhere between 11% and 47%.
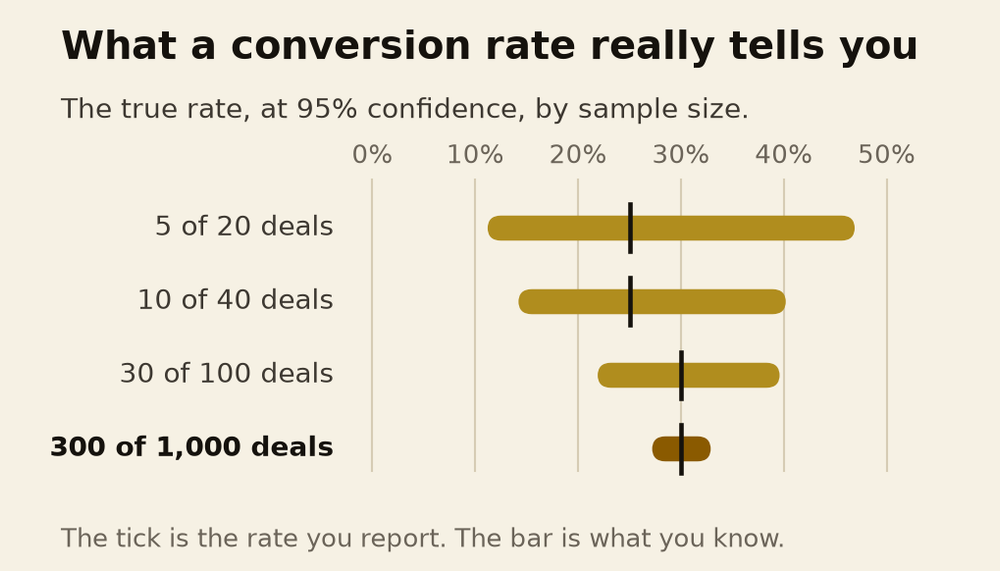
Read the chart and the implication is uncomfortable. Two stages showing 25% and 40% on twenty deals each are statistically indistinguishable. You cannot tell them apart. If you have been reallocating effort based on a gap that size, you have been managing noise.
Use the Wilson interval for this, not the textbook formula you were taught. A 2001 paper in *Statistical Science* showed the standard Wald interval has erratic coverage even at moderate sample sizes, and its textbook defence is misleading. At zero conversions the Wald formula returns an interval of exactly zero width, which would tell you that you know the true rate precisely from having observed nothing.
One shortcut worth memorising. The rule of three: if you saw zero conversions in n attempts, the 95% upper bound on the true rate is roughly 3 divided by n. Zero out of 30 does not mean the rate is zero. It means the rate is probably under 10%.
How much data you actually need
This is the question nobody answers, so here are real numbers.
To detect a difference between a 20% and a 30% conversion rate, with 80% power at the usual confidence level, you need about 291 deals in each group.
Most teams are working with forty.
At 40 deals per group, your power to detect 20% versus 30% is 18%. You would miss that difference four times out of five. From a 20% baseline, the smallest difference you could reliably catch is a rise to about 49%.
So if you close one or two deals a month, almost no stage-to-stage comparison in your CRM is readable, and you should stop pretending otherwise. What you can do instead is at the end of this article.
There is a second trap stacked on the first. Every extra comparison buys another chance to be fooled. Three tests give you a 14% chance of at least one false positive. Five gives 23%. Ten gives 40%. Twenty gives 64%. A funnel with five stages has four conversions in it, and across four segments that is sixteen comparisons. You will find something. You were always going to find something.
And a specific error to name, because it is everywhere: concluding that stage two is broken because its interval excludes your benchmark while stage three's does not. The difference between significant and not significant is not itself significant. Compare the two rates to each other directly.
The paradox that reverses your conclusion
This is the one that genuinely changes diagnoses, and it is worth sitting with.
Consider a stage two to stage three conversion across two quarters.
- Quarter one. SMB: 30 of 60 convert, 50%. Enterprise: 4 of 20, 20%. Blended: 34 of 80, 42.5%.
- Quarter two. SMB: 11 of 20, 55%. Enterprise: 15 of 60, 25%. Blended: 26 of 80, 32.5%.
Both segments improved by five points. The blended rate fell by ten.
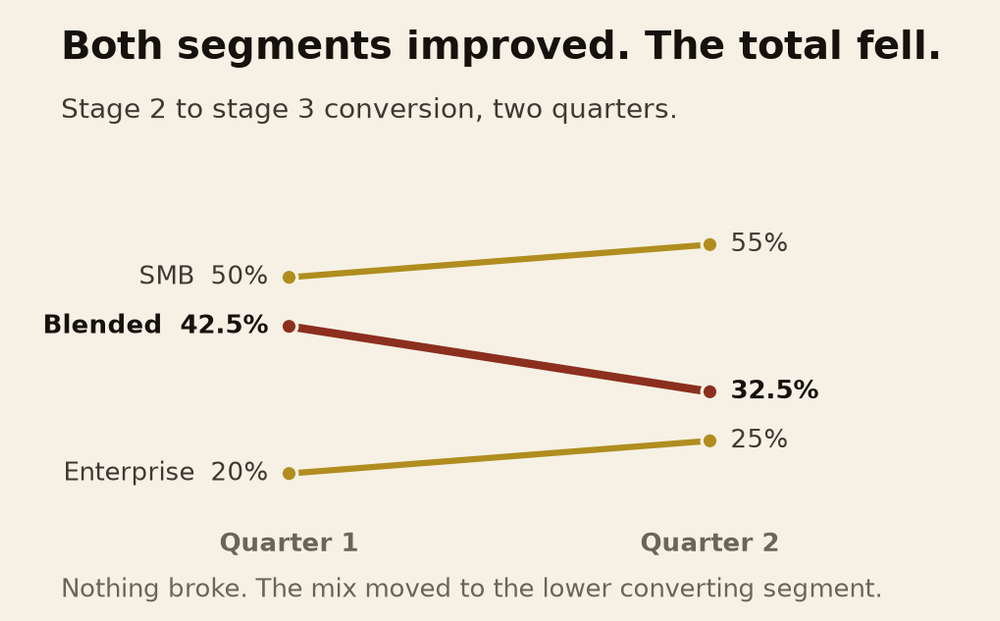
Nothing broke. The mix moved toward enterprise, which converts lower and always did. A team looking at the blended number spends the next quarter fixing a stage that is working better than it was.
This is Simpson's paradox, and it is documented in places far more consequential than a CRM. The canonical case is Berkeley's 1973 graduate admissions, where aggregate figures suggested bias against women and a department-level view reversed it, because women applied disproportionately to the hardest departments. There is a cleaner medical example: in a 1986 study of kidney stone treatments, open surgery had a better success rate than the alternative for small stones and for large stones, and a worse rate overall, because surgeons sent the hard cases to surgery.
The same reversal shows up in rep performance. Rep A wins 80% of small deals and 10% of large ones, for 66% overall. Rep B wins 85% of small and 15% of large, for 29% overall. Rep B is better at both and looks 37 points worse. Your rep leaderboard is a deal-mix leaderboard unless you hold mix constant.
So the rule is unconditional: segment before you conclude, every time. And check that your segmenting variable is not itself something the process changes, or you create the paradox rather than detecting it.
What your CRM structurally cannot show you
Four blind spots, each of which bends a diagnosis in a predictable direction.
Pre-opportunity loss. Leads that never became opportunities are invisible, including the ones a rep decided not to create. Your opportunity-to-win rate therefore looks healthy partly because the weak ones were filtered out upstream by human judgement that left no record. The first stage that looks broken is often just the first stage where that filtering stopped.
Censoring. Open deals have not finished yet. If you compute win rate by close month, you are measuring only deals that have already resolved, which biases you toward fast deals. Compute by creation cohort instead: take every deal created in January, and ask what has happened to all of them. Slow losses stop hiding.
Survivorship in your own analysis. The classic illustration is Abraham Wald's 1943 work on aircraft, where the planes available for inspection were by definition the ones that came back. Any pipeline analysis that starts from closed-won deals has thrown away the denominator. I found a widely cited forecasting study with exactly this flaw: 270,912 opportunities, all of them closed-won, with every forecast-then-lost deal absent.
Loss reasons are the weakest data in the system. A buyer says "it's the price" because that is the polite thing to say. The rep picks "price" from a dropdown. Several vendors publish figures on how often this is wrong, they disagree with each other, and all of them sell something. The mechanism is obviously real; the percentages are not established, and I am not going to quote one at you.
Related, and useful: analysis of a very large set of recorded sales conversations suggests 40% to 60% of qualified deals end in no decision at all. If your CRM codes those as lost to a competitor, your competitive analysis is describing a competitor who was never in the room.
Where the deals actually pile up
Conversion is only half the diagnosis. The other half is flow, and it has a clean piece of mathematics behind it.
Little's Law, published in 1961, says that the average number of items in a system equals the arrival rate times the average time each item spends in it. For a pipeline: open deals is roughly deal creation rate times average time to leave the pipeline, won or lost.
That gives you the question that separates two very different problems.
- Deals accumulate at a stage. Arrival exceeds throughput. This is a speed constraint. Adding more leads above it makes the queue longer and nothing else.
- Deals disappear at a stage. This is a conversion constraint, and more volume will partly work.
Most teams respond to both by adding volume at the top, which is correct for one and actively harmful for the other.
The discipline here comes from Eliyahu Goldratt's Theory of Constraints: find the constraint, get everything you can out of it, subordinate the rest of the system to it, and only then add capacity. The step people skip is subordination, which in sales means not feeding a stage that is already holding a queue.
I should be straight about the evidence. The best-known meta-analysis of Theory of Constraints applications found no reported failures across more than eighty cases, which its own authors note is a selection effect, since the sample was assembled from published successes. Little's Law is mathematics and holds. Applying it to a sales pipeline is my reasoning, not a sourced result.
What this looked like on a real account
I took over paid acquisition on an account that had spent fifteen months trying to make it work. Nothing had scaled past roughly $2,000 a month. Several people had tried. The assumption in the building was that the audience was too expensive.
The audience was not too expensive. Within that engagement the campaign reached $3.77 per lead across $49,533.87 of spend and 13,147 leads.
What made the difference was not a better ad. It was noticing that the previous fifteen months had tested the same layer over and over. Every attempt had been a creative test or an audience test, which are both the demand layer. Nobody had looked below it.
That is the failure mode this entire article is about. A team that cannot see which layer is broken does not stop working. It works very hard on the layer it can see. Fifteen months of real effort, all aimed one level too high.
The sequence I actually run
No validated published method exists for this. I looked. What follows is assembled from binomial statistics, Little's Law, selection-bias methodology and Theory of Constraints, and the combination is mine rather than anything you can cite.
- Build cohorts by creation date, not close date. Every deal created in a month, and where all of them stand now. This single change removes the censoring bias and usually changes the picture before you compute anything.
- Compute a Wilson interval for every stage conversion. Write the interval next to the rate on the page. Half your apparent problems will visibly overlap.
- Segment before concluding, always. By deal size, by source, by segment. If a stage looks worse in aggregate and better within every segment, your mix moved and the stage is fine.
- Check where deals accumulate versus where they vanish. Median days in stage, by cohort. Queue means speed constraint; disappearance means conversion constraint. The fixes are opposite.
- Count how many comparisons you just made. If it is more than about five, treat a single surprising result as a hypothesis rather than a finding.
- Change one stage, then wait a full average sales cycle. Changing two tells you nothing, and judging before a cycle completes measures your fastest deals only.
- When the sample is too small for any of this, stop measuring rates and read deals. At one or two closes a month, twenty lost-deal post-mortems will teach you more than any statistic your data can support. This is the honest answer for small teams, and almost nobody gives it.
The part that is not arithmetic
All of the above tells you where the funnel breaks. It does not tell you why, and it cannot.
The number says deals stop after the second call. Reading thirty of those deals tells you that the second call is where the buyer's finance person joins, and that your deck has no answer for them. One of those is a measurement. The other is a diagnosis.
Run the arithmetic first so you are reading the right thirty deals.
Then go and read them.

Ahmad Zabir
GTM expert and marketing consultant for SaaS companies, software houses and fitness brands. He diagnoses why growth stalls, designs the fix, and trains the team to run it.
One teardown a month
Research like this, before it goes public. No cadence promises I will not keep.
How Software Houses Get Clients Beyond Upwork and Referrals
When Upwork and referrals are most of your revenue. Upwork's take rate has risen from 15.4% to 19.6% while the platform shrank, and the real constraint is that your best salesperson is also your most billable engineer.
Marketing Agency or In-House: The Test That Answers It
No study compares the outcomes, so stop looking for one. The make-or-buy test that actually answers it, why clients leave agencies over budget cuts rather than performance, and when the answer is neither.
How to Judge an Outsourced SDR Team in 30 Days
You cannot see effort or quality, and revenue is two quarters away. A 30-day scorecard and written kill criteria for an outsourced SDR or lead generation trial, built on what the economics of information actually predict.
Pipeline Stage Exit Criteria a Rep Cannot Fake
Your forecast lies because your stages measure your own team's activity. Peer-reviewed evidence that reps distort deal ratings in both directions, and how to write exit criteria from evidence only the buyer can produce.
Not sure which of these you actually need?
Bring your funnel and your numbers. You leave knowing what to fix first and what to ignore.
Apply for a Consult